

Every day we read about new cases of infected persons, hospitalised patients, some of them in intensive care, and, unfortunately, people with or without underlying health issues, who have passed away because of the virus.
The figures are in absolute numbers and rates and you have to be a statistician or epidemiologist to understand them. The only certain figures are the number of patients in hospitals and mortalities.
The figures on new cases reflect the testing for the coronavirus and is limited to those with symptoms. Test kits, especially the reagents, are still in short supply and all countries are trying to increase the number of tests.
The actual number of infected persons is estimated to 3% to 10% or more depending on country and could increase to 50% or more if the mitigation measures taken, such as lockdowns and social distancing, are not effective.
There are countries who are counting that this will happen and will create group immunity although they do not tell it openly. Instead of acting proactively and early, before the curve increases steeply and the number of patients will overburden the hospitals, they seem to have adopted a “wait-and-see” approach before imposing stricter lockdown measures.
This is not the case in Belgium where the authorities relatively early decided on lockdown measures and the experts are closely following the curve and commenting on it. Until now, most persons were infected before the lockdown entered into force and that explains the increase in numbers until now.
But in the coming days, we should hopefully see declining growth rates. According to the American John Hopkins Coronavirus Resource Center (link), which publishes daily updates of the spread of the coronavirus, flattening the curve involves reducing the number of new COVID-19 cases from one day to the next.
“This helps prevent healthcare systems from becoming overwhelmed. When a country has fewer new COVID-19 cases emerging today than it did on a previous day, that’s a sign that the country is flattening the curve.” We need to see a sustainable trend that this is actually happening.
Graph: Number of new cases of infected persons in Belgium
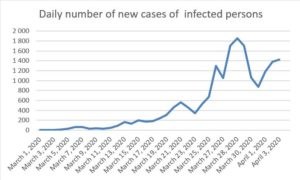
Credit: M. Apelblat
The Brussels Times