
A new climate tool was launched during COP27 which will bring climate transparency around the world to never-before-seen levels. Using AI and machine learning, the global tracker will help to clarify exactly where major greenhouse gas emissions are originating and which sectors are the main culprits.
As COP27 comes to a close, many will be pondering the events of the past days and all that has been unveiled and promised. Many COPs have come and gone with grand promises and pledges but with barely anything to show for it, and holding leaders accountable is difficult, largely due to the lack of available data regarding greenhouse gas emissions. That is where former US vice-president Al Gore's new initiative, in partnership with the Climate Trace coalition, comes in. Last week, UN Secretary-General António Guterres announced the launch of Climate Trace.
"Climate TRACE will be ushering in an era of radical transparency for emissions tracking – providing independent emissions data based primarily on direct observation of emitting activities," Guterres said at the launch.
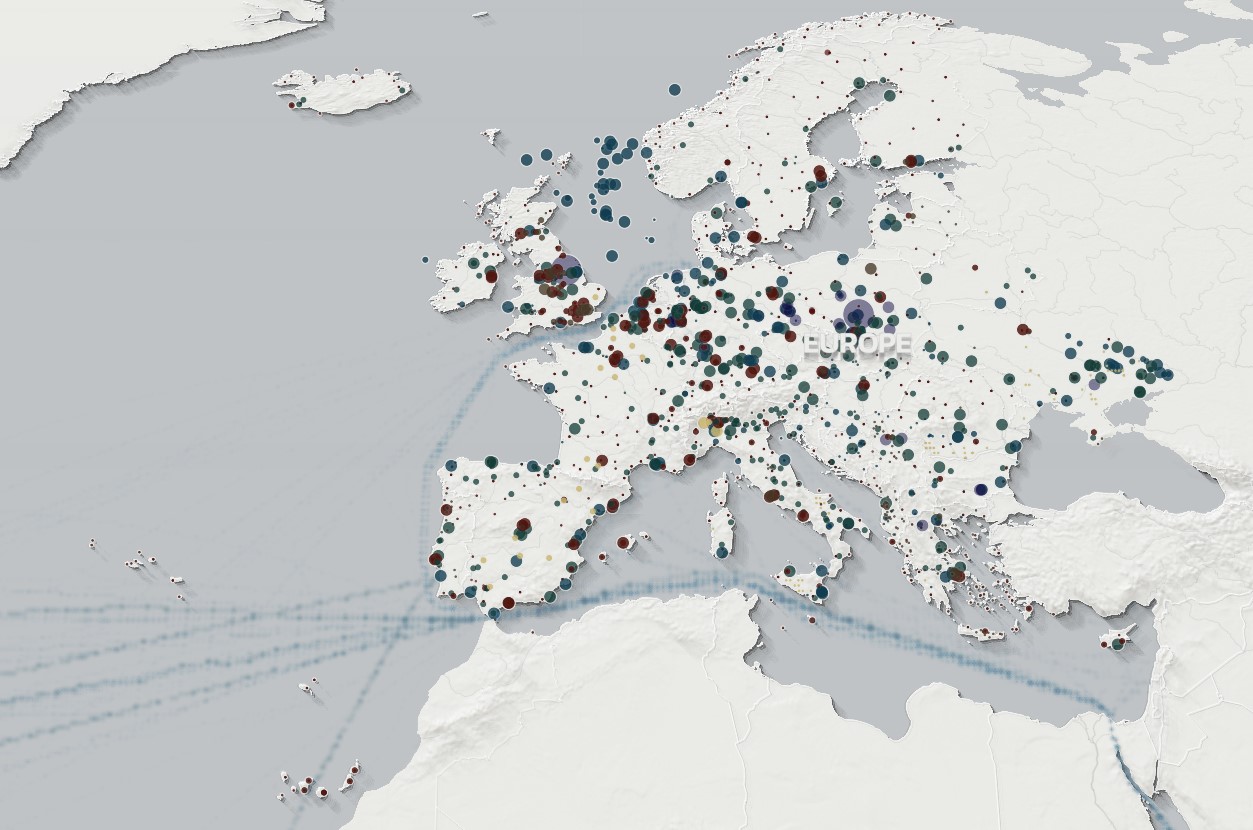
The map of Europe with the largest greenhouse gas emitters from the biggest power plants in Germany all the way to the airports in the small Portuguese and Spanish Islands off the coast of Africa. Credit: Climate Trace website
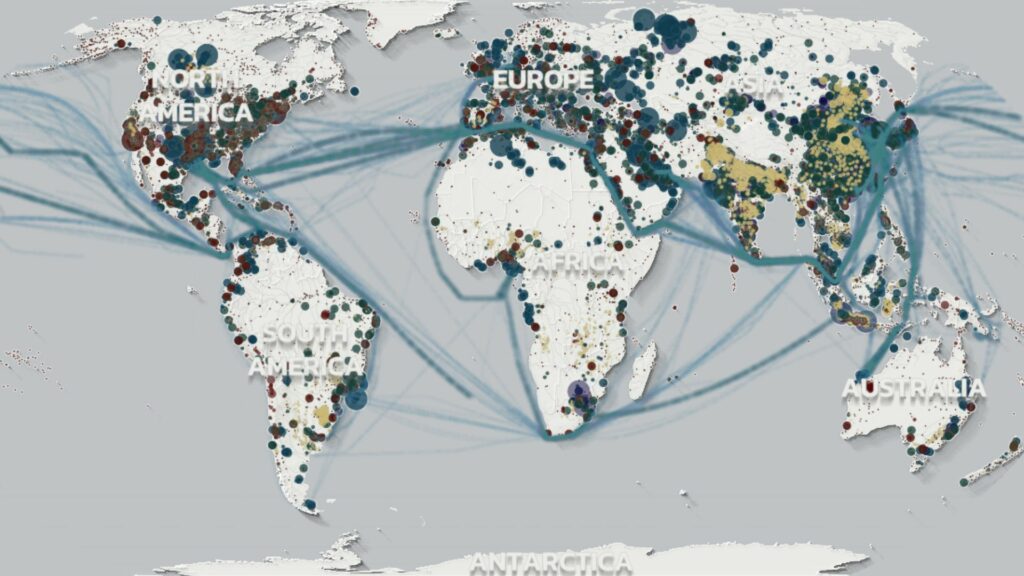
The inventory offers emissions data broken down by every country and major sector, and also offers emissions data on more than 70,000 of the largest individual sources of emissions worldwide, including things like power plants, oil and gas fields, industrial facilities, cargo ships, and much more. The data is represented in an interactive map which visually depicts where the highest emissions come from, and notably where it does not come from.
Where the data comes from
Climate TRACE analyses over 59 trillion bytes of data from more than 300 satellites, more than 11,100 sensors, and numerous additional public and commercial datasets from all over the world by harnessing AI and machine learning. AI has been trained to spot subtle differences in satellite imagery, data patterns, and more, enabling Climate TRACE to independently analyse and calculate emissions from individual sources.
The reasons driving the creation and implementation of Climate TRACE were due to the fact that nearly 100 countries lack access to comprehensive emissions data, due in part to the significant challenges and costs associated with gathering accurate and timely information.
Climate TRACE data enable governments to craft ambitious policies and track progress in reducing emissions to reach their net-zero targets.
Additionally, the tool provides the granularity needed to take action for private sector actors working to reduce their climate footprints.
It is also a critical tool for advocates to hold governments and the private sector accountable to their emissions reduction pledges.
Interesting findings
Since the launch of the tool, a few facts have stood out namely that half of the 50 largest sources of emissions are oil and gas production fields and their associated facilities.
Additionally, emissions from oil and gas production are significantly underreported, with the data now showing that, of the countries required to report regularly to the UNFCCC, emissions are as much as three times higher.