Despite periods of high inflation and economic instability, Belgians remain consistent in terms of their budgeting practices, according to recent data published by the Belgian statistics agency, Statbel.
Every two years, Statbel conducts the 'Household Budget Survey' in Belgium to measure how Belgians structure their spending. In 2024, nearly 5,500 Belgian households were included in the survey.
Last year, the largest expense for Belgians was - unsurprisingly - housing. Around a third (30.6%) of the budget for households in the country was spent on rent, water, gas, electricity and other fuels. This is consistent with the figures from 2018 (30.3%), 2020 (31.8%) and 2022 (30.7%).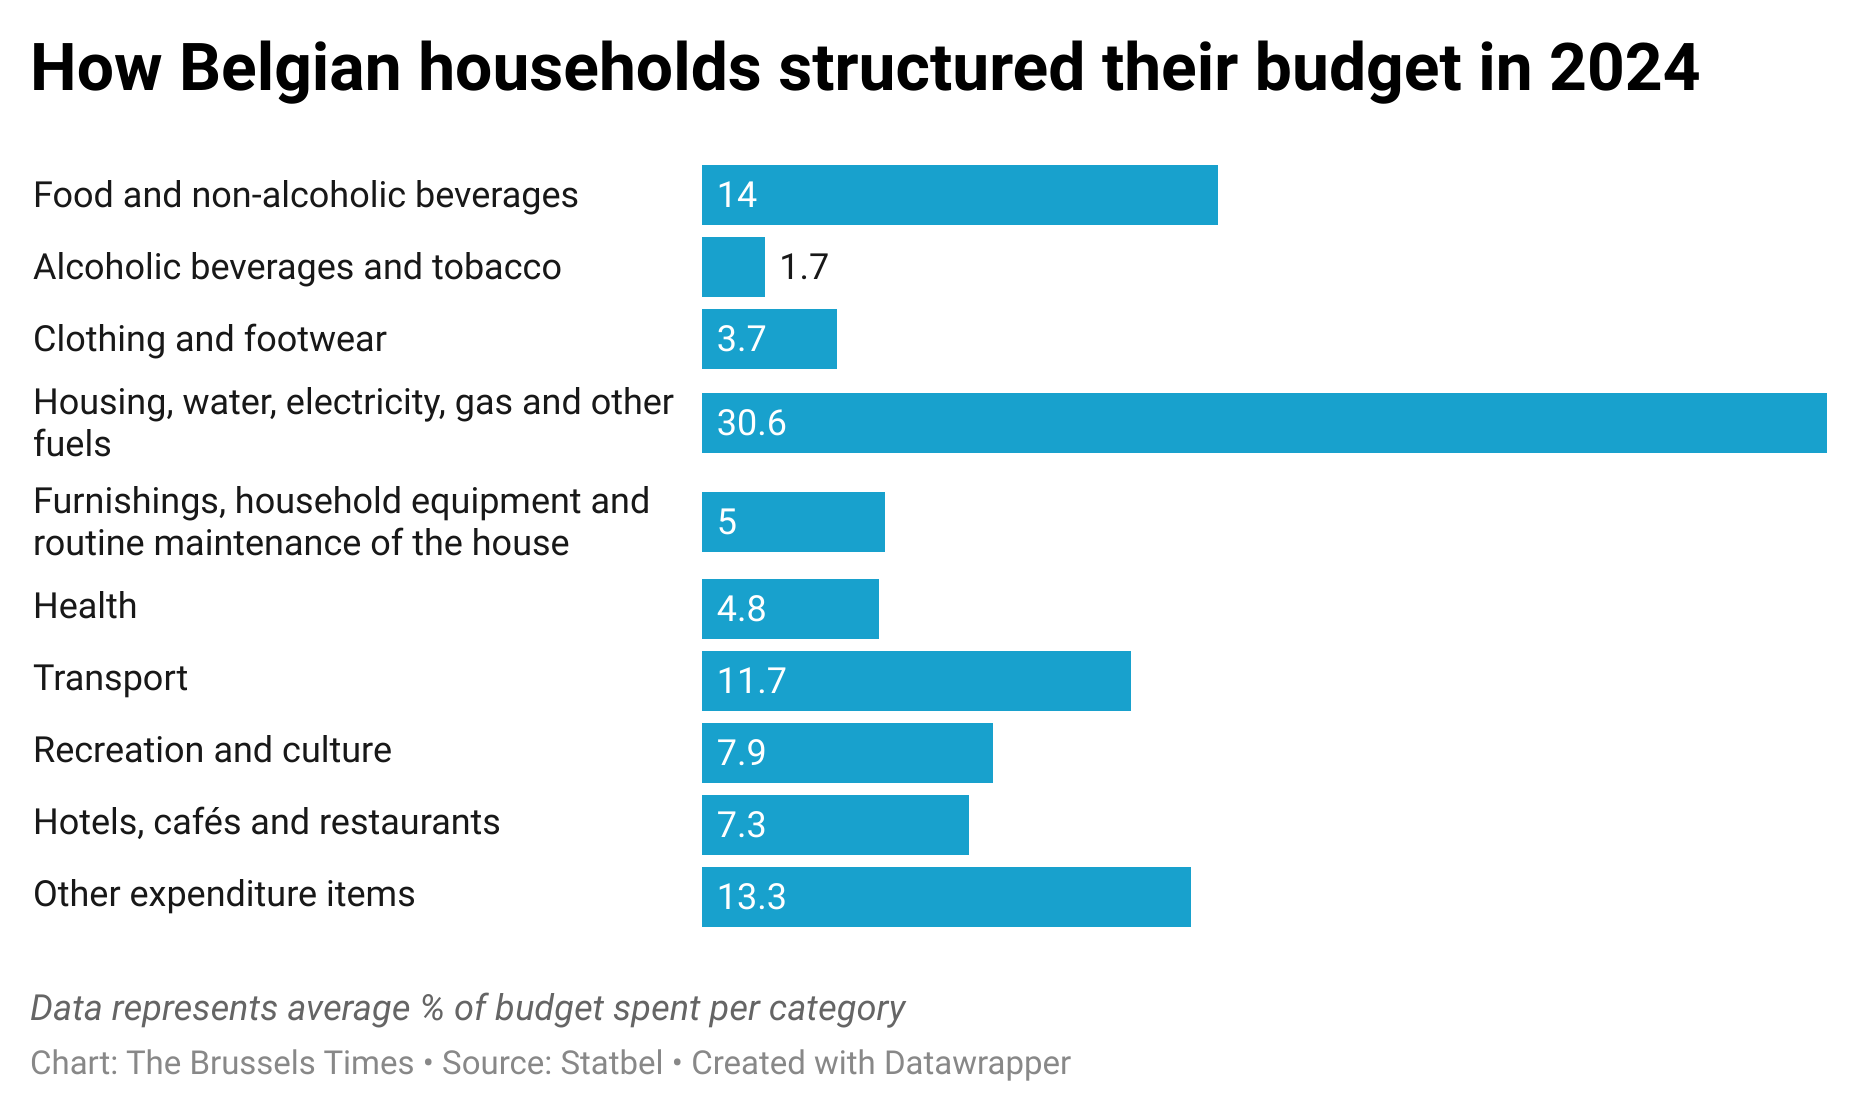 Alcoholic beverages and tobacco accounted for the smallest share of the budget (1.7%) last year. This is a slight decrease compared to 2018 (2.0%) and 2022 (1.9%).
Similarly, the proportion of the budget spent on clothing and footwear is also declining, with 3.7% of the budget spent on this category in 2024, compared to 4% in 2022 and 4.6% in 2018.
Nonetheless, some categories of expenses saw an increase in spending from Belgian households last year.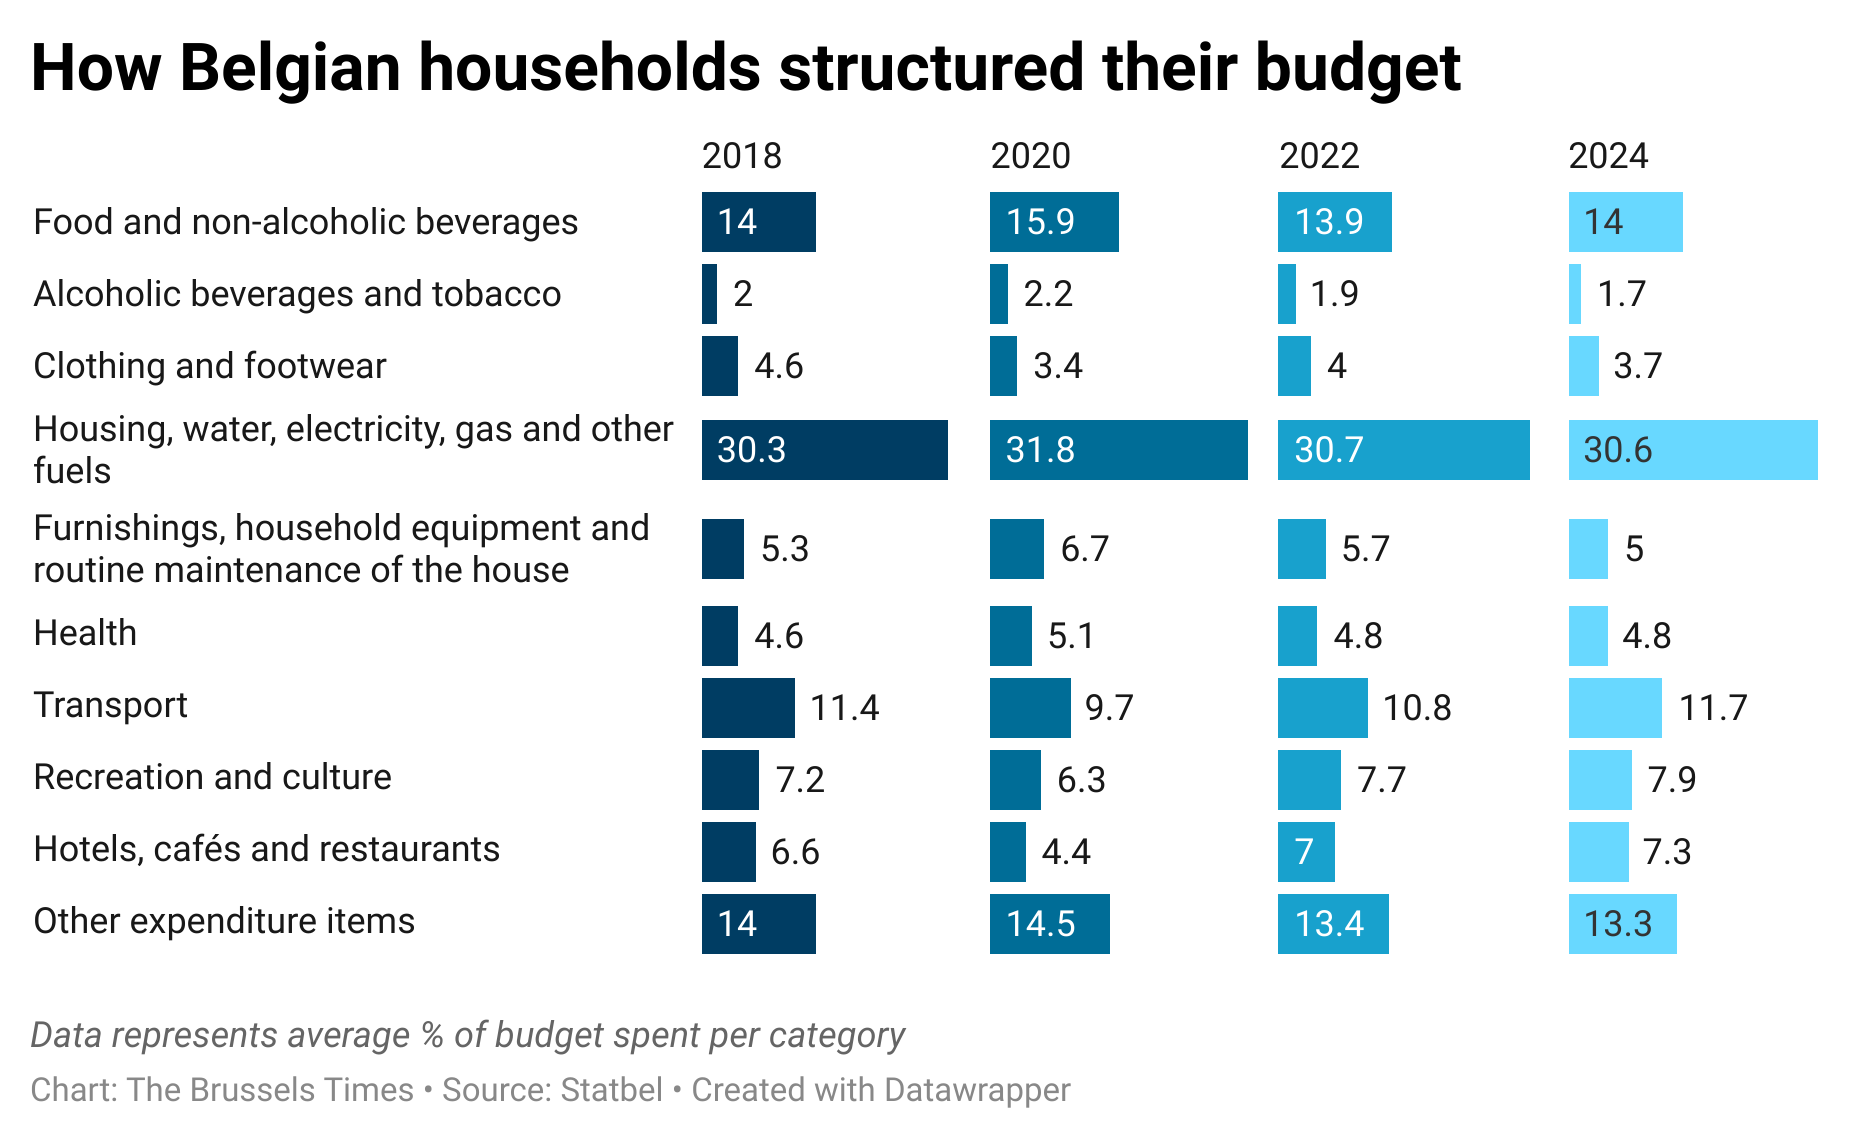 The proportion of the budget spent on transport has notably been rising since the COVID-19 pandemic. In 2024, an average of 11.7% of household budgets was dedicated to transport, compared to 10.8% in 2022 and 9.7% in 2020. Statbel attributes this to a rise in purchases of personal vehicles in the country.
Belgians are also dedicating a rising portion of their budget to recreational and cultural activities (7.9% in 2024), as well as hotels, cafés and restaurants (7.3%).
Notably, Statbel highlights a sharp increase in all-inclusive travel, which rose by 37.3% between 2022 and 2024.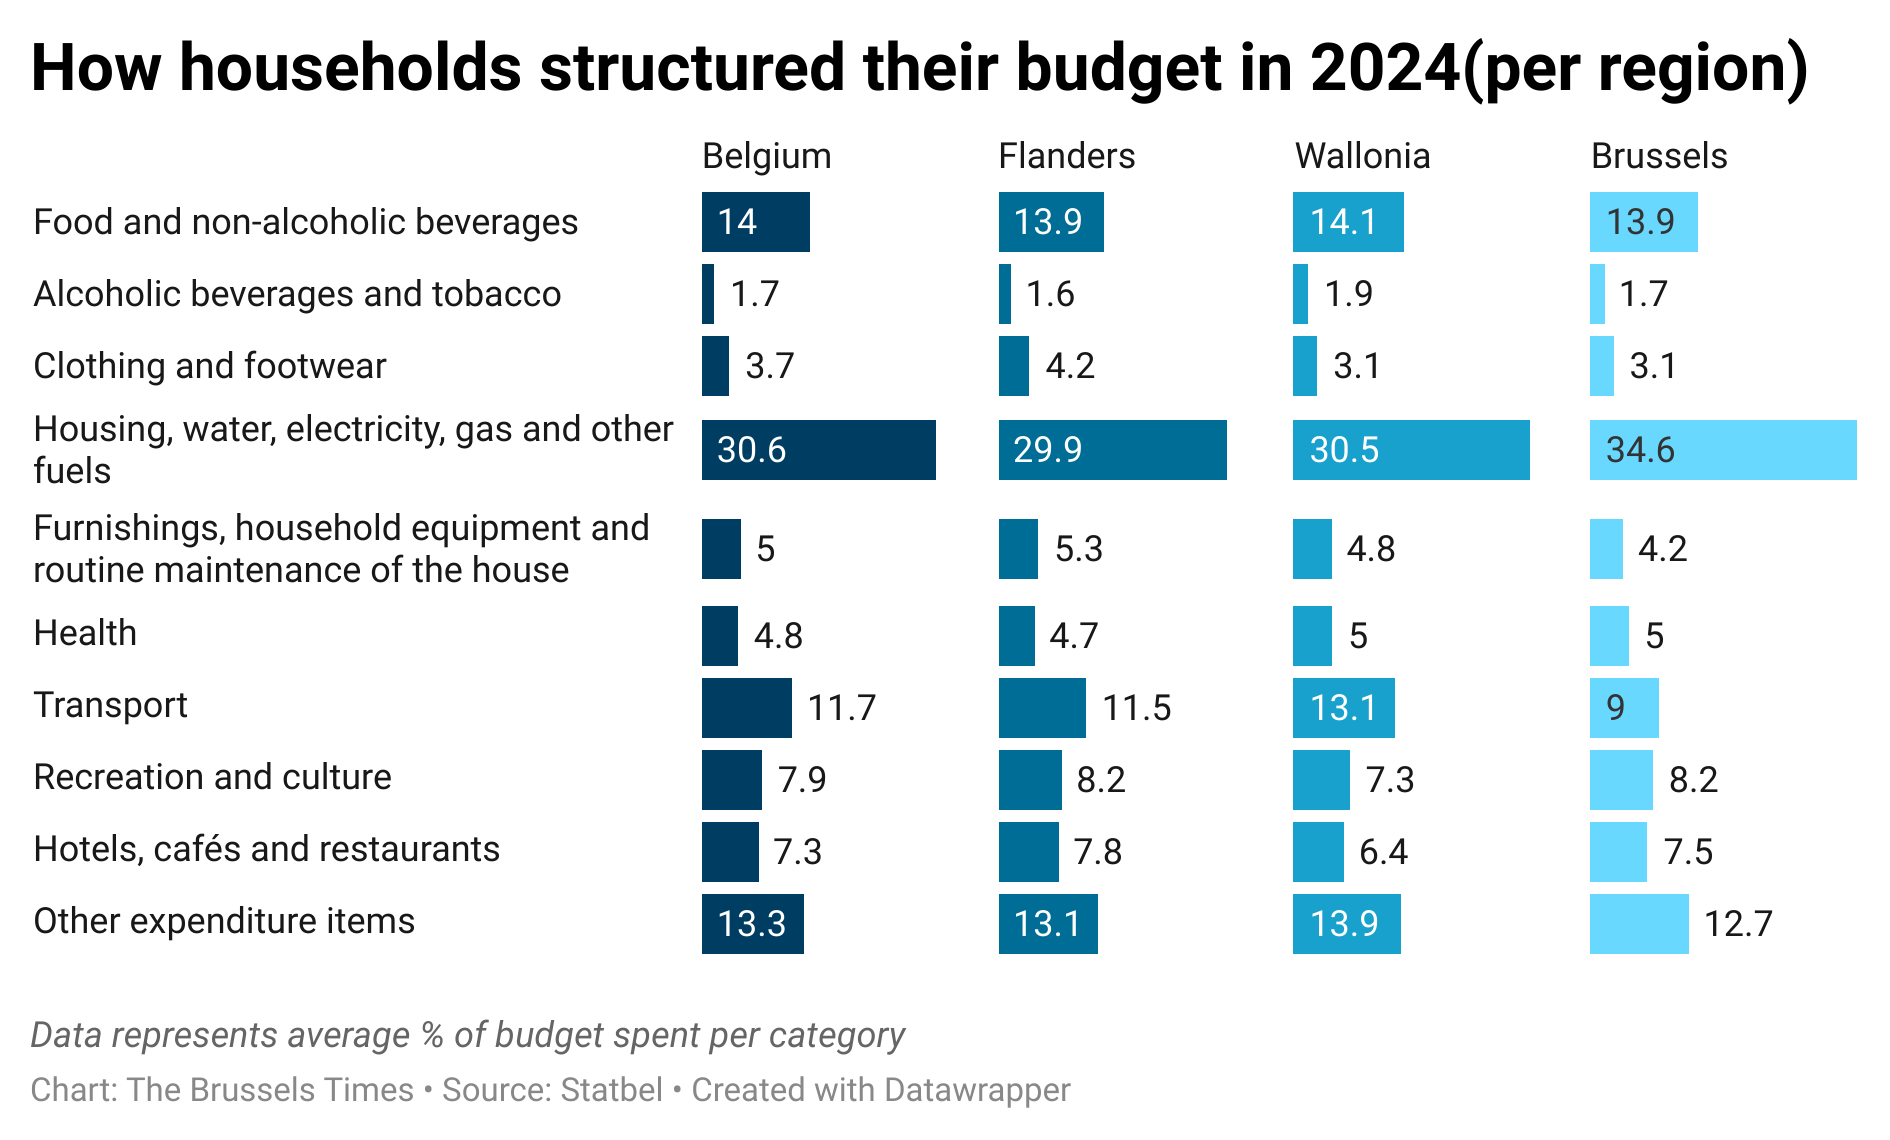 While the division of household budgets is somewhat similar in each region in Belgium, there are a few remarkable differences.
Last year, households in the Brussels Capital-Region spent the largest share (34.6%) of their budget on housing, followed by Wallonia (30.5%) and Flanders (29.9%).
Meanwhile, in terms of transport, Brussels households dedicated the lowest share of their budget to this category when compared to Flanders (11.5%) and Wallonia (13.1%).
The trend in transport budget is likely because the majority of households in the capital do not own a car. This allows them to avoid costly maintenance and repair services, which Walloon households spend a significant amount of their transport budget on, according to Statbel.