
The registration of new commercial vehicles fell by 20.3% across Europe in the first six months of 2022, with the percentage dropping further to 22.5% in the month of June.
The Brussels-based trade association European Automobile Manufacturers’ Association (ACEA) attributes the lack of vehicle registration to a drop in the sales of new vans, which accounts for 80% of the total drop in registration.
The four largest EU markets suffered drops in the double digits, including Spain (-26.9%), Germany (-26.1%), Italy (-21.3%) and France (-20.9%).
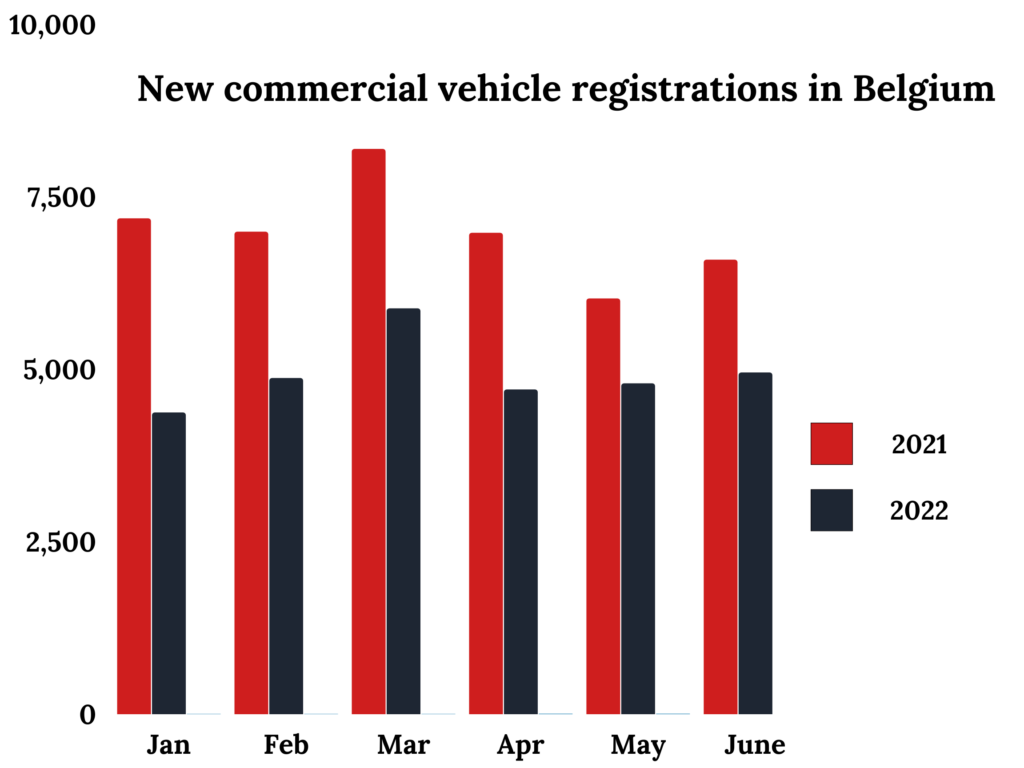
Graphic by Abby Stetina for The Brussels Times, with data from ACEA.
Belgium saw significant decreases in vehicle registrations compared to the same time period in 2021, with January and March showing the largest difference.
According to the trade association, 12.7 million Europeans work in the auto industry and may be directly or indirectly affected by the drop in vehicle registrations.
Motor vehicles are responsible for €398.4 billion of tax revenue for European governments.
One car for every two people living in the European Union
In 2020, there were a total of 0.53 passenger cars per inhabitant within the European Union, according to data from Eurostat, the EU’s statistics agency.
In terms of cars per 1,000 inhabitants, western EU Member States have some of the highest car-ownership rates, whereas the eastern Member States tend to have much lower car ownership rates.
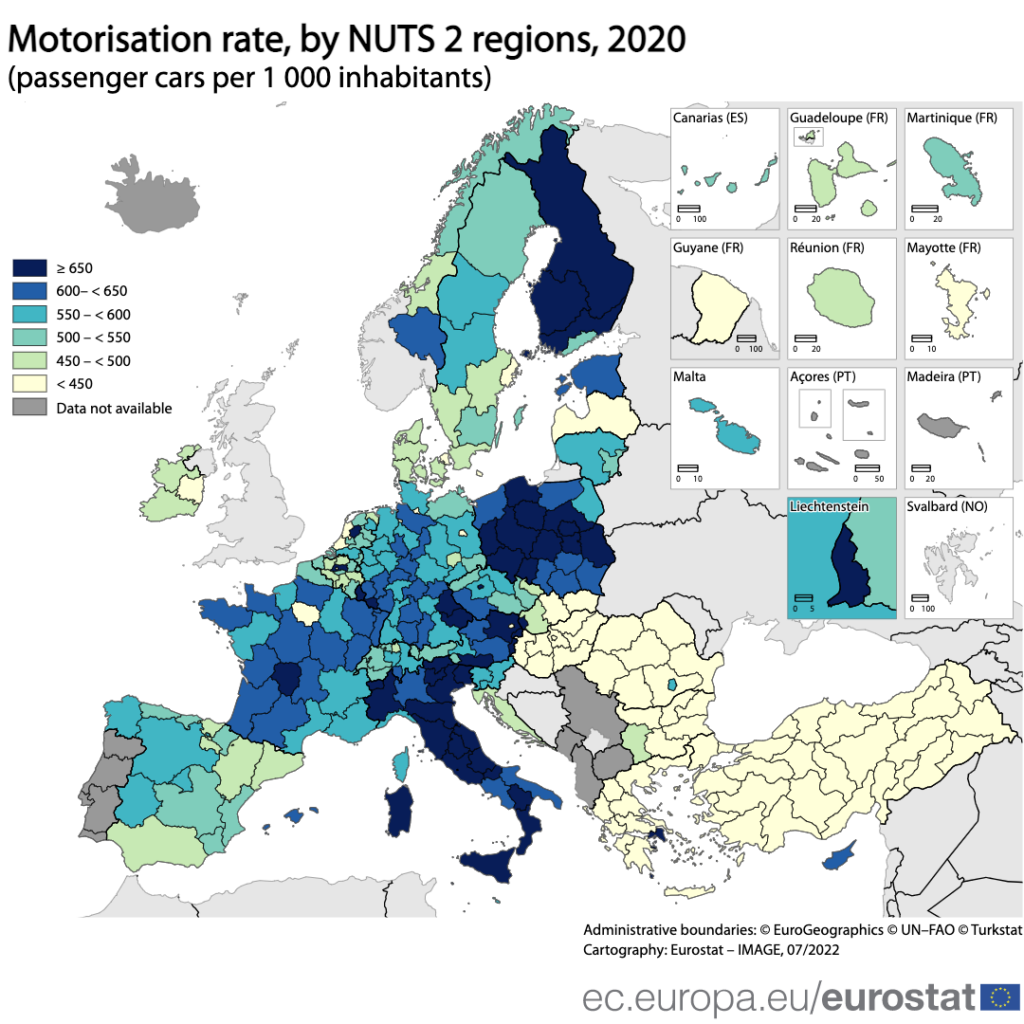
The motorisation rate by territorial units in Europe. Credit: Eurostat
According to the data, the highest motorisation rate in the EU was recorded in Valle D’Aosta in northwestern Italy, with 1,787 cars per 1,000 inhabitants.
The lowest car ownership rate was recorded on the French island of Mayotte, where there were just 72 cars per 1,000 inhabitants. Some of the lowest car ownership rates were recorded within France’s overseas territories and Greece’s many islands.
These differences are defined by various factors such as taxation rules, connectivity, and levels of infrastructure.
In Belgium, Eurostat recorded an average of 509 vehicles per 1,000 residents or around 5.9 million vehicles. The highest car-ownership rates in Belgium were recorded in Flemish Brabant (679), Limburg (544), Walloon Brabant (518), and Luxembourg province (508).
Related News
- Retrofitting offers solution for converting to electric cars by 2035
- Low emission zones: 40% increase across Europe in three years
- BMW asks consumers to pay subscription for features already installed in car
The lowest rate was observed in the capital, Brussels, where there were just 401 cars per 1,000 residents.
The capital is actively trying to convince residents to ditch their cars in favour of public transport and more sustainable mobility solutions. Around half of Belgians living alone no longer own a car, according to statistics from Belgium’s statistics agency, Statbel. In total, just 53% of Brussels families now own a car.
The pandemic has greatly changed the way that people in Belgium get around. The sale of new cars has declined significantly since the Covid-19 pandemic, while 2021 was a record year for the sale of used cars and the registration of new vehicles also fell at the start of the year.